Because I’m too lazy to google every time…
sudo su
apt-get clean
apt-get autoremove --purge
journalctl --vacuum-size=100M
rm /var/log/*.gz
rm /var/log/*.1Because I’m too lazy to google every time…
sudo su
apt-get clean
apt-get autoremove --purge
journalctl --vacuum-size=100M
rm /var/log/*.gz
rm /var/log/*.1I think this may go down as the most valuable skill I’ve learned my entire career.
$ telnet smtp-relay.myisp.com 25
Trying 10.10.32.1...
Connected to smtp-relay.myisp.com.
Escape character is '^]'.
220 myisp.net ESMTP MAIL Service ready - Wed, 18 Oct 2023 16:44:08 GMT
helo localhost
250 myisp.net Hello [10.98.76.54], pleased to meet you
mail from: me@mydomain.com
250 2.1.0 me@mydomain.com... Sender ok
rcpt to: me@mydomain.com
250 2.1.5 me@mydomain.com... Recipient ok
data
354 Enter mail, end with "." on a line by itself
From: me@mydomain.com
To: me@mydomain.com
Subject: Test

Hello there
.
250 2.0.0 39IGi8N5006729 Message accepted for delivery
QUIT
221 2.0.0 myisp.net closing connection
Connection closed by foreign host.I have some scripts designed to perform basic troubleshooting and admin tasks in GCP. The authentication is handled via Google Default Application credentials, where the user runs this command:
gcloud auth application-default loginThis creates a credentials file, which is $HOME/.config/gcloud/application_default_credentials.json in similar. Alternately, they can authenticate as a service account by setting the GOOGLE_APPLICATION_CREDENTIALS environment variable. In my Python code, I read the credentials and retrieve an access token:
from oauth2client.client import GoogleCredentials

credentials = GoogleCredentials.get_application_default()
access_token = credentials.get_access_token().access_token
Which I can then use to make HTTPS calls as the user, using IAM permissions in GCP to control access to projects and resources.
Problem is, oauth2client has been deprecated since 2019. The recommended replacement is google-auth. I had a heck of a time finding a simple real-world example get the access token, but here it is. The trick is use default() to get the credentials, then refresh() to generate a fresh access token:
from google.auth import default
from google.auth.transport.requests import Request

SCOPES = ['https://www.googleapis.com/auth/cloud-platform']

credentials, project_id = default(scopes=SCOPES, quota_project_id='xxxxxx')
credentials.refresh(Request())
access_token = credentials.token
An alternate solution is use Credentials.from_authorized_user_file() to read the credentials. It is faster, but takes some extra work to determine the location of the JSON file. Assuming GOOGLE_APPLICATION_CREDENTIALS is set:
from os import environ
from google.oauth2.credentials import Credentials

_ = environ.get('GOOGLE_APPLICATION_CREDENTIALS')
credentials = Credentials.from_authorized_user_file(_, scopes=SCOPES)
BTW, to instead use a Service Account for authentication, just use these two lines instead:
from google.oauth2.service_account import Credentials

credentials = Credentials.from_service_account_file(_, scopes=SCOPES)
One of the trickier parts about building complex hybrid cloud networks is it’s difficult to troubleshoot scenarios where there’s multiple paths.
GCP doesn’t offer a way to view this in Web UI or CLI (gcloud), but it is accessible via the routers.getRouterStatus() method in the API. This essentially queries a specific cloud router for detailed BGP information. The JSON will look like this. Of most interest is the asPaths list.
{
  "kind": "compute#routerStatusResponse",
  "result": {
    "network": "https://www.googleapis.com/compute/v1/projects/xxx/global/networks/yyy",
    "bestRoutes": [
      {
        "kind": "compute#route",
        "creationTimestamp": "2023-06-14T13:17:31.690-07:00",
        "network": "https://www.googleapis.com/compute/v1/projects/xxx/global/networks/yyy",
        "destRange": "10.20.30.0/24",
        "priority": 100,
        "nextHopIp": "169.254.22.73",
        "nextHopVpnTunnel": "https://www.googleapis.com/compute/v1/projects/xxx/regions/us-east4/vpnTunnels/vpn-0",
        "routeType": "BGP",
        "asPaths": [
          {
            "pathSegmentType": "AS_SEQUENCE",
            "asLists": [
              4200000000
            ]
          }
        ]
      },
      {
        "kind": "compute#route",
        "creationTimestamp": "2023-06-14T13:17:31.690-07:00",
        "network": "https://www.googleapis.com/compute/v1/projects/xxx/global/networks/yyy",
        "destRange": "10.20.30.0/24",
        "priority": 100,
        "nextHopIp": "169.254.22.74",
        "nextHopVpnTunnel": "https://www.googleapis.com/compute/v1/projects/xxx/regions/us-east4/vpnTunnels/vpn-1",
        "routeType": "BGP",
        "asPaths": [
          {
            "pathSegmentType": "AS_SEQUENCE",
            "asLists": [
              4200000000
            ]
          }
        ]
      },
    ]
  }
}
Finally got some time to start exploring the CheckPoint management server’s API via web. As with most vendors, the tricky part was understanding the required steps for access and making basic calls. Here’s a quick walk-through.
By default, access is only permitted from the Management server itself. To change this, do the following:
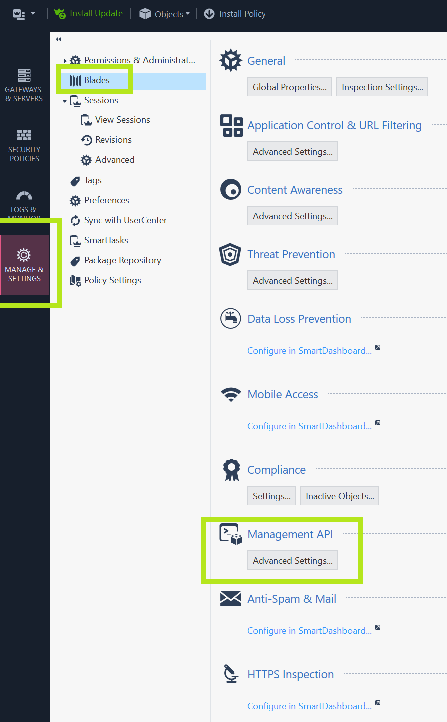
2. Change this to “All IP Addresses that can used by GUI clients” or simply “All IP Addresses”.
3. Click OK. You’ll see a message about restarting API
4. Click the the “Publish” button at the top
5. SSH to the Management Server and enter expert mode. Then enter this command:
api restart6. After the restart is complete, use the command api status to verify the accessibility is no longer “Require Local”
[Expert@chkp-mgmt-server:0]# api status

API Settings:
---------------------
Accessibility:                      Require all granted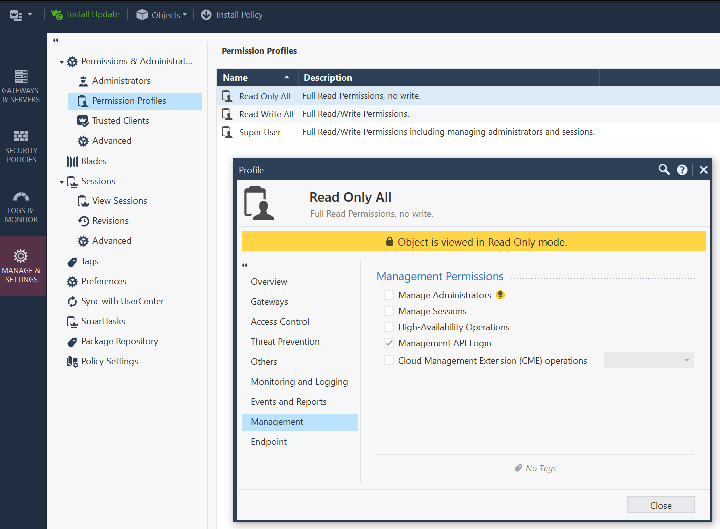
Automatic Start: EnabledWhile in Smart Console , also verify that your account and permission profile has API login access by examining the Permission profile and look under the “Management” tab. This should be true by default.
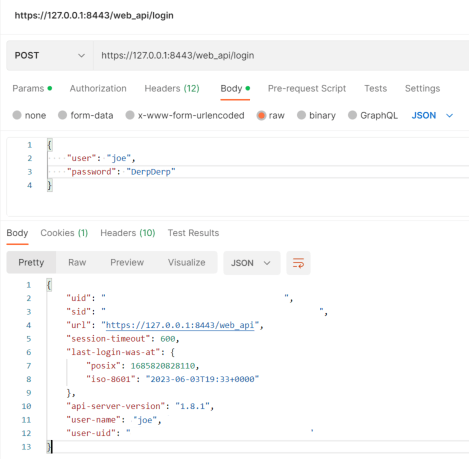
Now we’re ready to hit the API. First step generally is do a POST to /web_api/login to get a SID (session token). There are two required parameters: ‘user’ and ‘password’. Here’s a postman example. Note the parameters are raw JSON in the body (not the headers):
With the SID obtained, we can copy/paste it and start sending some actual requests. There’s a few things to keep in mind
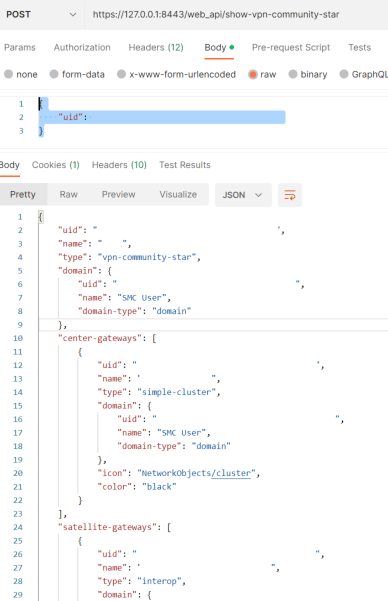
Here’s another Postman example getting the a list of all Star VPN Communities:

To get full details for a specific object, we have to specify the name or uuid in the POST body. For example, to get more information about a specific VPN community, make a request to /web_api/show-vpn-community-star with this:
{
    "uid": "fe5a4339-ff15-4d91-bfa2-xxxxxxxxxx"
}
You’ll get back an object (aka python dictionary) back.
I desperately need to get some graphs on connections for Checkpoint after being unable to activate the monitoring blade for a cloud deployment with a PAYG license. Good ol’ Cacti was the quickest way to do accomplish that.
Sample graphs:

I upgraded my FreeBSD VM from 11 to 12 last weekend. Installing Google Cloud SDK was no problem; just use the FreeBSD package:
pkg install google-cloud-sdkBut for AWS CLI tools, there’s only a package for AWS CLI Tools version 1 . CLI Tools version 2 has been out for 3 years now, so we really don’t want to still be using v1.
Usually there’s a simple work-around: since AWS CLI tools is mostly Python scripts, you can install it via PIP. First, verify the version of Python installed, then install PIP3 for that version:
python -V
Python 3.11.13

pkg install py311-pip
Then install AWS CLI Tools v2 via PIP:
pip install awscliv2But when we go to complete the install, we get this error:
awscliv2 --install
09:27:26 - awscliv2 - ERROR - FreeBSD amd64 is not supported, use docker version
This is because AWS CLI v2 does rely on a binary, and is only compiled for Linux. We can work around this by enabling Linux emulation.
First, add the following lines to /etc/rc.conf
linux_enable="YES"
Then either run this command, or simply reboot:
service linux startAlso install the CentOS 7 base from packages:
pkg install linux_base-c7Add an couple lines to the the following line near the bottom of /usr/local/lib/python3.9/site-packages/awscliv2/installers.py to allow it to support FreeBSD:
    if os_platform == "FreeBSD" and arch == "amd64":
        return install_linux_x86_64()
Now we can complete the install successfully:
# awscliv2 --install
21:53:29 - awscliv2 - INFO - Installing AWS CLI v2 for Linux
21:53:29 - awscliv2 - INFO - Downloading package from https://awscli.amazonaws.com/awscli-exe-linux-x86_64.zip to /tmp/tmpg6a6_kvx.zip
21:53:32 - awscliv2 - INFO - Extracting /tmp/tmpg6a6_kvx.zip to to /tmp/tmpzm5c3jho
21:53:38 - awscliv2 - INFO - Installing /tmp/tmpzm5c3jho/aws/install to /root/.awscliv2
21:53:48 - awscliv2 - INFO - Now awsv2 will use this installed version
21:53:48 - awscliv2 - INFO - Running now to check installation: awsv2 --version
aws-cli/2.30.3 Python/3.13.7 Linux/5.15.0 exe/x86_64.centos.7
Verify the binary and libraries are installed correctly:
ln -s /usr/local/bin/awscliv2 /usr/local/bin/aws
aws --version
aws-cli/2.11.10 Python/3.11.2 Linux/3.2.0 exe/x86_64.centos.7 prompt/off
You’ll probably want to include this directory in your path. Since I use TCSH, I do this by adding this line to ~/.cshrc:
set path = (/sbin /bin /usr/sbin /usr/bin /usr/local/sbin /usr/local/bin $HOME/bin $HOME/.awscliv2/v2/2.30.3/dist)You’re now ready to configure aws cli tools v2. Run this command:
aws configureOr, just manually setup the files ~/.aws/config and ~/.aws/credentials. Then try out a command.
aws s3 ls
Use the AWS_PROFILE and AWS_REGION environment variable to override the defaults configured in ~/.aws/config
Previously, the envoy-based Internal HTTP(S) load balancers could only be accessed within the same region. For orgs that leverage multiple regions and perform cross-region traffic, this limitation was a real pain point, and not a problem for AWS ALBs. So, I’m glad to see it’s now offered:

Oddly, the radio button only shows up during the ILB creation. To modify an existing one, use this gcloud command:
gcloud compute forwarding-rules update NAME --allow-global-accessOr, in Terraform:
resource "google_compute_forwarding_rule" "default" {
  allow_global_access   = true
}
It’s also important to be aware that Global access on the HTTP(S) ILB must be enabled if accessing from another load balancer via PSC. If not, you’ll get this error message:
 Error 400: Invalid value for field 'resource.backends[0]': '{  "resourceGroup": "projects/myproject/regions/us-west1/networkEndpointGroups/psc-backend", ...'. Global L7 Private Service Connect consumers require the Private Service Connect producer load b
alancer to have AllowGlobalAccess enabled., invalid
For most of my troubleshooting tools, I want to avoid the security concerns that come with managing service accounts. Using my account also lets me access multiple projects. To do the authentication in Python, I’d originally installed google-api-python-client and then authenticated using credentials=None
from googleapiclient.discovery import build

try:
    resource_object = build('compute', 'v1', credentials=None)
except Exception as e:
    quit(e)
This call was a bit slow (2-3 seconds) and I was wondering if there was a faster way. The answer is ‘yes’ – just use OAuth2 tokens instead. Here’s how.
If not done already, generate a login session via this CLI command:
gcloud auth application-default loginYou can then view its access token with this CLI command:
gcloud auth application-default print-access-token
You should see a string back that’s around 200 characters long. Now we’re ready to try this out with Python. First, install the oauth2client package:
pip3 install oauth2clientNow the actual python code to get that same access token:
from oauth2client.client import GoogleCredentials

try:
    creds = GoogleCredentials.get_application_default()
except Exception as e:
    quit(e)

print("Access Token:", creds.get_access_token().access_token)
This took around 150-300 ms to execute which is quite a bit faster and reasonable.
If using raw HTTP calls via requests, aiohttp, or http.client, set a header with ‘Authorization’ as the key and ‘Bearer <ACCESS_TOKEN>’ as the value.
If you’ve got an ISP that forces all outbound e-mail to go via their servers, the solution to this is called SMTP smart hosting, where one SMTP server uses another SMTP server as a relay or proxy, essentially acting like a Mail User Agent (client) than a Mail Transfer Agent (server). If running FreeBSD, the default mail server will be sendmail and it’s a little unclear how to set this up.
For me, I just decided to really start from scratch with a custom config file with the SMART_HOST setting. Here’s the file I created, saving it as /etc/mail/custom.mc:
divert(0)
VERSIONID(`$FreeBSD: releng/12.2/etc/sendmail/freebsd.mc 363465 2020-07-24 00:22:33Z gshapiro $')
OSTYPE(freebsd5)
FEATURE(access_db, `hash -o -T<TMPF> /etc/mail/access')
FEATURE(mailertable, hash -o /etc/mail/mailertable)
FEATURE(virtusertable, hash -o /etc/mail/virtusertable)
DOMAIN(generic)
DAEMON_OPTIONS(`Name=IPv4, Family=inet')
DAEMON_OPTIONS(`Name=IPv6, Family=inet6, Modifiers=O')
MASQUERADE_AS(`freebsd.mydomain.com)
FEATURE(`masquerade_envelope')
define(`SMART_HOST', `smtp.mydomain.com')
MAILER(local)
MAILER(smtp)
Then ran a few commands to build the config file using m4 and restart sendmail:
cd /etc/mail
cp sendmail.cf sendmail.cf.bak
m4 /usr/share/sendmail/cf/m4/cf.m4 custom.mc > sendmail.cf
touch local-host-names
/etc/rc.d/sendmail restart
Since I’m sending the e-mails via Python, I used this test script:
import smtplib

subject = "Test"
sender = "me@freebsd.mydomain.com"
recipient = "me@gmail.com"
smtp_host = "127.0.0.1"

message = f"From: {sender}\nTo: {recipient}\nSubject: {subject}\n\n"

try:
     server = smtplib.SMTP(smtp_host, port=25)
     server.ehlo()
     server.sendmail(sender, recipient, message)
     server.quit()
except Exception as e:
     quit(e)
