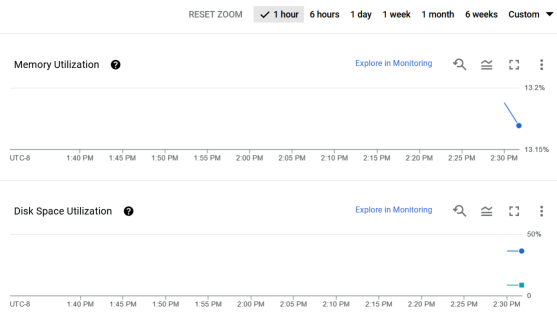
I desperately need to get some graphs on connections for Checkpoint after being unable to activate the monitoring blade for a cloud deployment with a PAYG license. Good ol’ Cacti was the quickest way to do accomplish that.
Sample graphs:

I desperately need to get some graphs on connections for Checkpoint after being unable to activate the monitoring blade for a cloud deployment with a PAYG license. Good ol’ Cacti was the quickest way to do accomplish that.
Sample graphs:
The VMs were deployed via Terraform using instance templates, managed instance groups, and an internal TCP/UDP load balancer with a forwarding rule for port 3128. Debian 11 (Bullseye) was selected as the OS because it has a low memory footprint while still offering an nice pre-packaged version of Squid version 4.
The first problem is the older stackdriver agent isn’t compatible with Debian 11. So I had to install the newer one. I chose to just add these lines to my startup script, pulling the script directly from a bucket to avoid the requirement of Internet access:
gsutil cp gs://public-j5-org/add-google-cloud-ops-agent-repo.sh /tmp/
bash /tmp/add-google-cloud-ops-agent-repo.sh --also-install
After re-deploying the VMs, I ssh’d in and verified the Ops agent was installed and running:
sudo systemctl status google-cloud-ops-agent"*"
google-cloud-ops-agent-opentelemetry-collector.service - Google Cloud Ops Agent - Metrics Agent
Loaded: loaded (/lib/systemd/system/google-cloud-ops-agent-opentelemetry-collector.service; static)
Active: active (running) since Fri 2023-02-10 22:18:17 UTC; 18min ago
Process: 4317 ExecStartPre=/opt/google-cloud-ops-agent/libexec/google_cloud_ops_agent_engine -service=otel -in /etc/google-cloud-ops-agent/config.yaml -logs ${LOGS_DIRECTORY} (code=exited, status=0/>
Main PID: 4350 (otelopscol)
Tasks: 7 (limit: 1989)
Memory: 45.7M
CPU: 1.160s
After waiting a couple minutes, I still didn’t see anything, so I downloaded and ran their diagnostic script:
gsutil cp gs://public-j5-org/diagnose-agents.sh /tmp/ && bash /tmp/diagnose-agents.sh
This was confusing because while it didn’t show any errors, the actual log was dumped to disk in a sub-directory of /var/tmp/google-agents/
. and did indicate a problem in the agent-info.txt
file:
API Check - Result: FAIL, Error code: LogApiPermissionErr, Failure:
Service account is missing the roles/logging.logWriter role., Solution: Add the roles/logging.logWriter role to the Google Cloud service account., Res
ource: https://cloud.google.com/stackdriver/docs/solutions/agents/ops-agent/authorization#create-service-account
And this made sense, because in order for Ops Agent to function, it needs these two IAM roles enabled for the service account:
Here’s a Terraform snippet that will do that:
# Add required IAM permissions for Ops Agents
locals {
roles = ["logging.logWriter", "monitoring.metricWriter"]
}
resource "google_project_iam_member" "default" {
for_each = var.service_account_email != null ? toset(local.roles) : {}
project = var.project_id
member = "serviceAccount:${var.service_account_email}"
role = "roles/${each.value}"
}
Within a few minutes of adding these, data started showing up in the graphs.
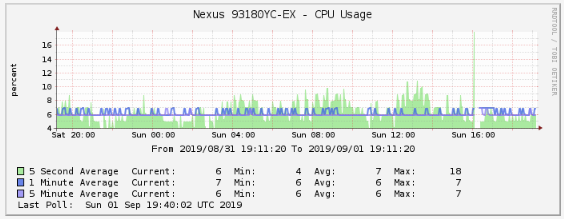
Tested on Nexus 93180YC-EX running 7.0(3)I7(6), but should work on others.
https://drive.google.com/open?id=16GLnmSXUbnpu7LWP9p7fdS5nxvJAK5OJ
Sample graphs:
While working through my CSR1000v stability woes, I had the need to automatically generate a “show tech” and then reboot a router after an IP SLA failure was detected. It seemed fairly easy but I could never get the show tech fully completed before the EMM script would stop running, and the reboot command never worked either.
Posting on Reddit paid off as user caught the problem: EEM scripts by default can only run for 20 seconds. Since a “show tech” can take longer than this, the subsequent steps may never be processed. The solution is increase the runtime to say 60 seconds to guarantee the show tech completes:
! Create and run IP SLA monitor to ping default gateway every 5 seconds ip sla 1 icmp-echo 10.0.0.1 source-interface GigabitEthernet1 threshold 50 timeout 250 frequency 5 ! ip sla schedule 1 life forever start-time now ! ! Create track object that will mark down after 3 failures track 1 ip sla 1 delay down 15 up 30 ! ! Create EMM script to take action when track state is down event manager session cli username "ec2-user" event manager applet GatewayDown authorization bypass event track 1 state down maxrun 60 action 100 cli command "en" action 101 cli command "term len 0" action 110 syslog priority notifications msg "Interface Gi1 stopped passing traffic. Generating diag info" action 300 cli command "delete /force bootflash:sh_tech.txt" action 350 cli command "show tech-support | redirect bootflash:sh_tech.txt" action 400 syslog priority alerts msg "Show tech completed. Rebooting now!" action 450 wait 5 action 500 reload
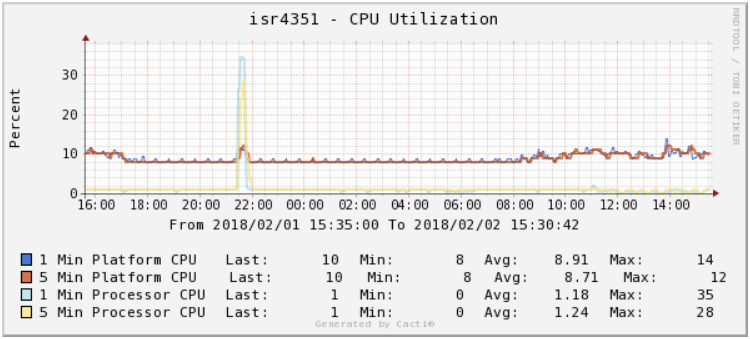
Starting seeing these pop up periodically on an ISR 4351.
PLATFORM-4-ELEMENT_WARNING: SIP2: smand: RP/0: Used Memory value 89% exceeds warning level 88% Severity Level : 3
A simple reboot of the router lowered the platform memory in use and also stabilized it.
One important thing to understanding in IOS-XE is the different numbers that can be returned when checking CPU and memory statistics. There’s some very down in the weeds docs on this, but the simplest way to break it down is process vs. platform. Processes is essentially control plane, while platform is data plane.
CLI command: show processes cpu
SNMP OIDs:
1.3.6.1.4.1.9.2.1.56.0 = 5 second 1.3.6.1.4.1.9.2.1.57.0 = 1 minute 1.3.6.1.4.1.9.2.1.58.0 = 5 minute
CLI command: show processes cpu platform
SNMP OIDs:
1.3.6.1.4.1.9.9.109.1.1.1.1.3.7 = 5 second 1.3.6.1.4.1.9.9.109.1.1.1.1.4.7 = 1 minute 1.3.6.1.4.1.9.9.109.1.1.1.1.5.7 = 5 minute
Note – Most platforms will be multi-core.
CLI command: show processes memory
SNMP OIDs:
1.3.6.1.4.1.9.9.48.1.1.1.5.1 = Memory Used 1.3.6.1.4.1.9.9.48.1.1.1.6.1 = Memory Free
CLI command: show platform resources
SNMP OIDs:
1.3.6.1.4.1.9.9.109.1.1.1.1.12.7 = Memory Used 1.3.6.1.4.1.9.9.109.1.1.1.1.13.7 = Memory Free 1.3.6.1.4.1.9.9.109.1.1.1.1.27.7 = Memory Committed
These were written for Cacti 0.8.8f
https://spaces.hightail.com/space/FoUD1PvlXA
Give the cacti user permission to read the internal MySQL table for time zone names:
[j5@linux ~]$ mysql -u root -p mysql mysql> grant select on mysql.time_zone_name to cactiuser@'%'; Query OK, 0 rows affected (0.00 sec) mysql> flush privileges; Query OK, 0 rows affected (0.00 sec) mysql> quit
To populate MySQL with some Timezone information:
[j5@linux ~]$ mysql -u root -p mysql < /usr/share/mysql/mysql_test_data_timezone.sql Enter password:
Now there’s at least some stuff there:
mysql> select * from time_zone_name; +--------------------+--------------+ | Name | Time_zone_id | +--------------------+--------------+ | MET | 1 | | UTC | 2 | | Universal | 2 | | Europe/Moscow | 3 | | leap/Europe/Moscow | 4 | | Japan | 5 | +--------------------+--------------+ 6 rows in set (0.00 sec)
Had to do several reboots of the Cacti VM tonight to do some NFS mount fixes, and noticed graphs weren’t updating and the device list was returning zero rows. Immediately my thought was database, and this was confirmed in cacti.log
2017-09-13 22:00:00 - DBCALL ERROR: SQL Assoc Failed!, Error:145, SQL:"SELECT status, COUNT(*) as cnt FROM `host` GROUP BY status" 2017-09-13 22:00:00 - DBCALL ERROR: SQL Assoc Failed!, Error: Table './cacti/host' is marked as crashed and should be repaired
Also in var/log/mysqld.log:
170913 22:03:00 [ERROR] /usr/libexec/mysqld: Table './cacti/host' is marked as crashed and should be repaired
This blog pointed me to the easy fix:
mysqlcheck -u cactiuser -p --auto-repair --databases cacti